Creates initial coefficient estimates for a selfStart wrapper around
logistic(), for use with stats::nls(). Supports both the 4-parameter
symmetric (A, B, xmid, slope) and 5-parameter asymmetric (A, B, xmid,
slope, asym) forms; arity is inferred from the formula passed to
stats::nls().
Arguments
- t
A numeric vector of the predictor variable (time).
- A
A numeric parameter for the starting asymptote of the response variable.
- B
A numeric parameter for the ending asymptote of the response variable.
- xmid
A numeric parameter for the time at the inflection point (the steepest point) of the curve, in units of the predictor variable
t.- slope
A numeric parameter for the response rate
dx/dtat the inflectionxmid.- asym
A numeric parameter for the asymmetry index of the curve; the fraction of the amplitude
(y(xmid) - A) / (B - A)at which the inflectionxmidoccurs, in(0, 1).asym = 0.5is symmetric and equivalent to the 4-parameter form. IfNULL(default), a symmetric 4-parameter model is used.
Details
Model formulas
4-parameter:
x ~ SSlogistic(t, A, B, xmid, slope)5-parameter:
x ~ SSlogistic(t, A, B, xmid, slope, asym)
The 4-parameter form is used by analyse_kinetics() with
method = "sigmoidal" and shape = "symmetric". The 5-parameter
asymmetric form is retained for advanced/experimental use only;
analyse_kinetics() instead dispatches to SSgompertz() /
SSgompertz_left() for asymmetric shapes, which are more stable.
stats::nls() reads the free parameters from the formula right-hand side,
so omitting asym incurs no degrees-of-freedom penalty.
Fixing parameters
Any parameter may be held constant by writing a value in place of its name
in the formula, e.g. x ~ SSlogistic(t, A = 0, B, xmid, slope) fixes the
starting asymptote at A = 0. Fixed parameters are excluded from
estimation and are not returned by stats::coef().
Examples
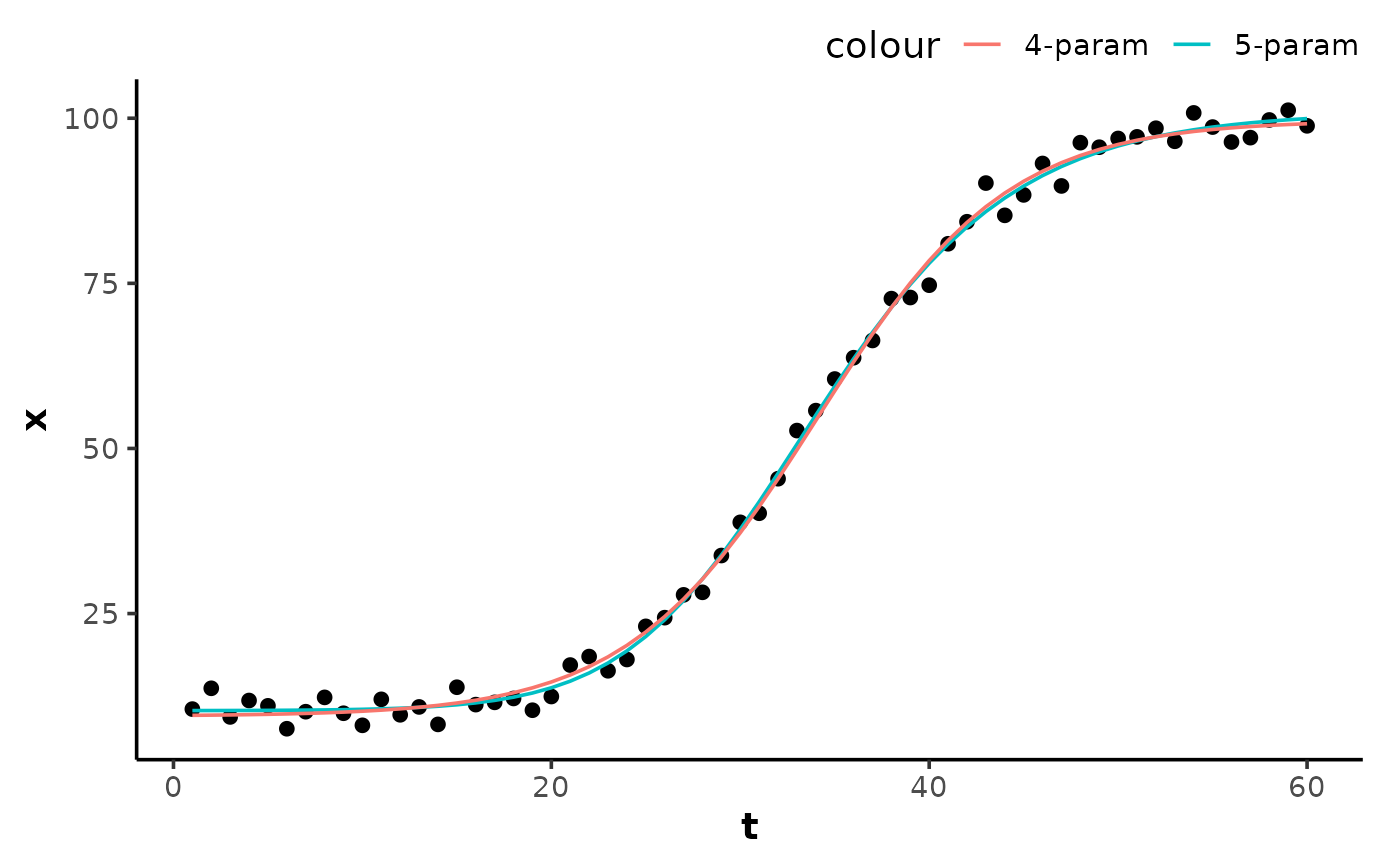
## create an asymmetric logistic curve with random noise
set.seed(15)
t <- 1:60
x <- logistic(t, A = 10, B = 100, xmid = 30, slope = 4, asym = 0.3) +
rnorm(length(t), 0, 2)
data <- data.frame(t, x)
## 4-parameter fit
model4 <- nls(x ~ SSlogistic(t, A, B, xmid, slope), data = data)
summary(model4)
#>
#> Formula: x ~ SSlogistic(t, A, B, xmid, slope)
#>
#> Parameters:
#> Estimate Std. Error t value Pr(>|t|)
#> A 9.4672 0.5023 18.85 <2e-16 ***
#> B 99.6797 0.6601 151.01 <2e-16 ***
#> xmid 34.0751 0.1671 203.92 <2e-16 ***
#> slope 4.4853 0.1073 41.79 <2e-16 ***
#> ---
#> Signif. codes: 0 ‘***’ 0.001 ‘**’ 0.01 ‘*’ 0.05 ‘.’ 0.1 ‘ ’ 1
#>
#> Residual standard error: 1.91 on 56 degrees of freedom
#>
#> Number of iterations to convergence: 5
#> Achieved convergence tolerance: 2.274e-06
#>
## 5-parameter fit on the same data
model5 <- nls(x ~ SSlogistic(t, A, B, xmid, slope, asym), data = data)
summary(model5)
#>
#> Formula: x ~ SSlogistic(t, A, B, xmid, slope, asym)
#>
#> Parameters:
#> Estimate Std. Error t value Pr(>|t|)
#> A 10.2987 0.5316 19.372 < 2e-16 ***
#> B 100.9565 0.9135 110.519 < 2e-16 ***
#> xmid 29.3426 2.5692 11.421 3.87e-16 ***
#> slope 3.8707 0.6245 6.198 7.69e-08 ***
#> asym 0.2743 0.1115 2.460 0.017 *
#> ---
#> Signif. codes: 0 ‘***’ 0.001 ‘**’ 0.01 ‘*’ 0.05 ‘.’ 0.1 ‘ ’ 1
#>
#> Residual standard error: 1.827 on 55 degrees of freedom
#>
#> Number of iterations to convergence: 5
#> Achieved convergence tolerance: 1.54e-06
#>
## fix the starting asymptote `A` at a known value
model_fixed <- nls(x ~ SSlogistic(t, A = 10, B, xmid, slope), data = data)
summary(model_fixed)
#>
#> Formula: x ~ SSlogistic(t, A = 10, B, xmid, slope)
#>
#> Parameters:
#> Estimate Std. Error t value Pr(>|t|)
#> B 99.5150 0.6340 156.97 <2e-16 ***
#> xmid 34.1344 0.1562 218.59 <2e-16 ***
#> slope 4.5262 0.1014 44.65 <2e-16 ***
#> ---
#> Signif. codes: 0 ‘***’ 0.001 ‘**’ 0.01 ‘*’ 0.05 ‘.’ 0.1 ‘ ’ 1
#>
#> Residual standard error: 1.913 on 57 degrees of freedom
#>
#> Number of iterations to convergence: 5
#> Achieved convergence tolerance: 1.034e-06
#>
y4 <- predict(model4, data)
y5 <- predict(model5, data)
# \donttest{
if (requireNamespace("ggplot2", quietly = TRUE)) {
ggplot2::ggplot(data, ggplot2::aes(t, x)) +
theme_mnirs() +
ggplot2::geom_point() +
ggplot2::geom_line(ggplot2::aes(y = y5, colour = "5-param")) +
ggplot2::geom_line(ggplot2::aes(y = y4, colour = "4-param"))
}
 # }
# }