Move the range of data channels in a data frame up or down, while preserving the absolute amplitude/dynamic range of each channel, and the relative scaling across channels. e.g. shift the minimum data value to zero for all positive values, or shift the mean of the first time span in a recording to zero.
Arguments
- data
A data frame of class "mnirs" containing time series data and metadata.
- nirs_channels
A character vector giving the names of mNIRS columns to operate on. Must match column names in
dataexactly.If
NULL(default), thenirs_channelsmetadata attribute ofdatais used.
- time_channel
A character string naming the time or sample column. Must match a column name in
dataexactly.If
NULL(default), thetime_channelmetadata attribute ofdatais used.
- to
A numeric value in units of
nirs_channelsto which the data channels will be shifted, e.g. shift the minimum value to zero.- by
A numeric value in units of
nirs_channelsby which the data channels will be shifted, e.g. shift all values up by 10 units.- width
An integer defining the local window in number of samples centred on
idx, between[idx - floor(width/2), idx + floor(width/2)].- span
A numeric value defining the local window time span around
idxin units oftime_channelort, between[t - span/2, t + span/2].- position
Indicates where the reference values will be shifted from.
"min"(The default) will shift the minimum value(s)
toorbythe specified value."max"Will shift the maximum value(s)
toorbythe specified values."first"Will shift first value(s)
toorbythe specified values.
- verbose
Logical. Default is
TRUE. Display or silence (ifFALSE) warnings and information messages helpful for troubleshooting. Ad global default can be set viaoptions(mnirs.verbose = FALSE).
Value
A tibble of class "mnirs" with metadata
available with attributes().
Details
nirs_channels = list() can be used to group data channels (column names)
to preserve absolute or relative scaling.
Channels grouped together in a vector (e.g.
list(c("A", "B"))) will be shifted to a common value, and the relative scaling within that group will be preserved.Channels in separate list vectors (e.g.
list("A", "B")) will be shifted independently, and relative scaling between groups will be lost.A single vector of channel names (e.g.
c("A", "B")) will group channels together.Channels (columns) in
datanot explicitly defined innirs_channelswill be passed through untouched to the output data frame.
nirs_channels and time_channel can be retrieved automatically from
data of class "mnirs" which has been processed with {mnirs},
if not defined explicitly. This will default to returning all
nirs_channels grouped together, and should be defined explicitly
for other grouping arrangements.
Only one of either to or by and one of either width or span should
be defined. If both of either pairing are defined, to will be preferred
over by, and width will be preferred over span.
Examples
## read example data
data <- read_mnirs(
file_path = example_mnirs("moxy_ramp"),
nirs_channels = c(smo2_left = "SmO2 Live",
smo2_right = "SmO2 Live(2)"),
time_channel = c(time = "hh:mm:ss"),
verbose = FALSE
) |>
shift_mnirs( ## un-grouped nirs channels to shift separately
nirs_channels = list(smo2_left, smo2_right),
to = 0, ## NIRS values will be shifted to zero
span = 120, ## shift the *first* 120 sec of data to zero
position = "first"
)
data
#> # A tibble: 2,202 × 3
#> time smo2_left smo2_right
#> <dbl> <dbl> <dbl>
#> 1 0 -1.56 2.22
#> 2 0.560 -1.56 2.22
#> 3 1.11 -1.56 0.225
#> 4 1.66 -1.56 0.225
#> 5 2.21 -1.56 0.225
#> 6 2.76 -1.56 0.225
#> 7 3.31 1.44 1.22
#> 8 3.86 1.44 1.22
#> 9 4.41 1.44 1.22
#> 10 4.96 1.44 1.22
#> # ℹ 2,192 more rows
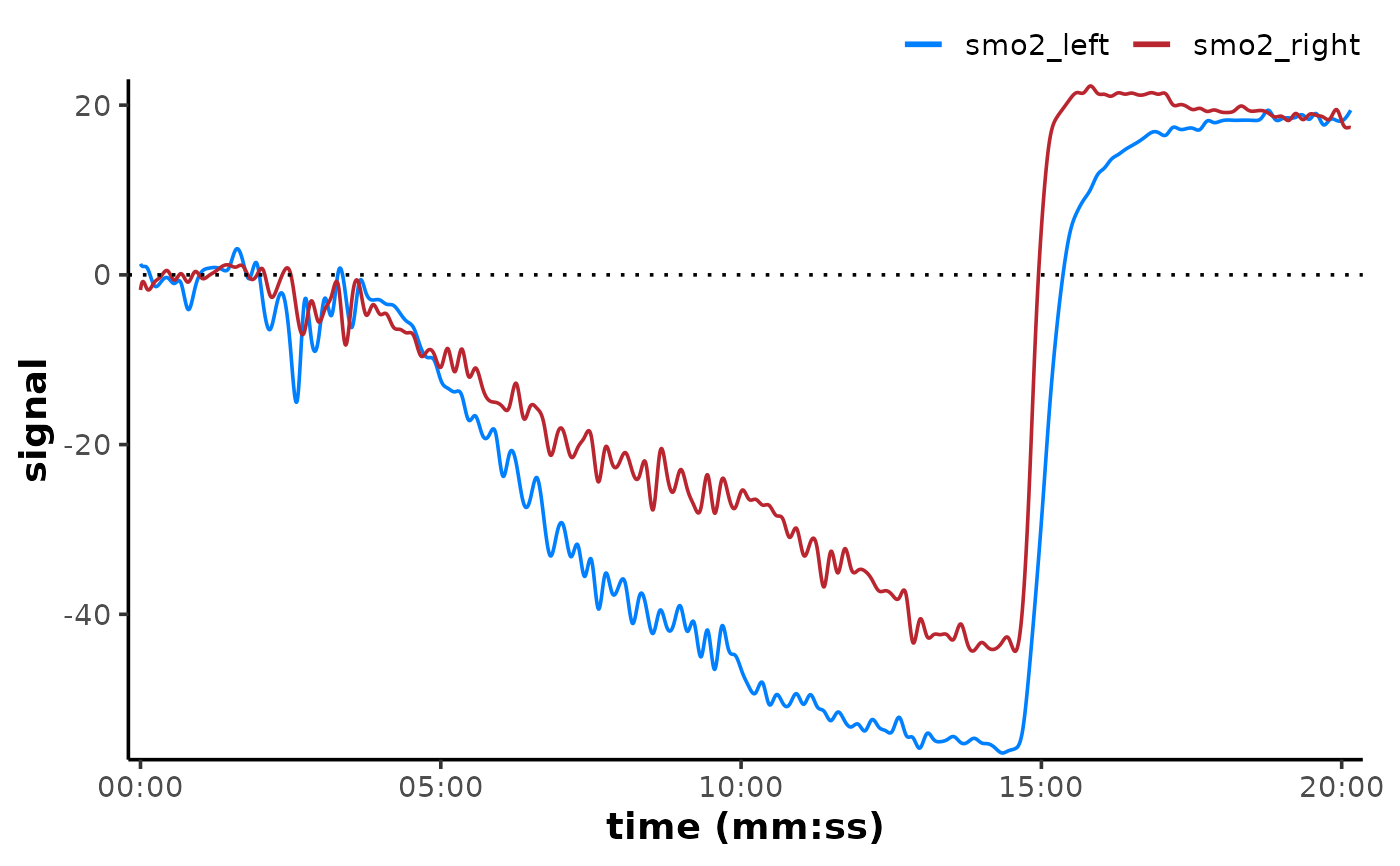
# \donttest{
if (requireNamespace("ggplot2", quietly = TRUE)) {
plot(data, time_labels = TRUE) +
ggplot2::geom_hline(yintercept = 0, linetype = "dotted")
}
 # }
# }