Create a base plot for data frames or lists of data frames with class "mnirs".
Usage
# S3 method for class 'mnirs'
plot(x, points = FALSE, time_labels = FALSE, na.omit = FALSE, ...)
Arguments
- x
Data frame or list of data frames of class "mnirs" (e.g. from
extract_intervals()). List input produces a faceted plot with one panel per element.- points
Logical. Default is
FALSE. IfTRUEdisplaysggplot2::geom_points(). Otherwise displaysggplot2::geom_lines().- time_labels
Logical. Default is
FALSE. IfTRUEdisplays x-axis time values formatted as "hh:mm:ss" usingformat_hmmss(). Otherwise, x-axis values are displayed as numeric.- na.omit
Logical. Default is
FALSE. IfTRUEomits missing (NA) and non-finitec(Inf, -Inf, NaN)from display.- ...
Additional arguments.
Value
A ggplot2 object.
Details
When x is a named list of "mnirs" data frames, elements are bound into a
single data frame and displayed as faceted panels via
ggplot2::facet_wrap().
Accepts some arguments in ..., such as nrow, ncol, and scales
passed to ggplot2::facet_wrap(). n.breaks overrides the default number
of y-axis breaks. breaks overrides the x-axis breaks directly.
Examples
data <- read_mnirs(
example_mnirs("train.red"),
nirs_channels = c(smo2 = "SmO2"),
time_channel = c(time = "Timestamp (seconds passed)"),
verbose = FALSE
)
## plot time labels as "hh:mm:ss"
plot(data, time_labels = TRUE)
 data_list <- extract_intervals(
data,
start = by_time(2452, 3168),
span = c(-60, 120),
verbose = FALSE
)
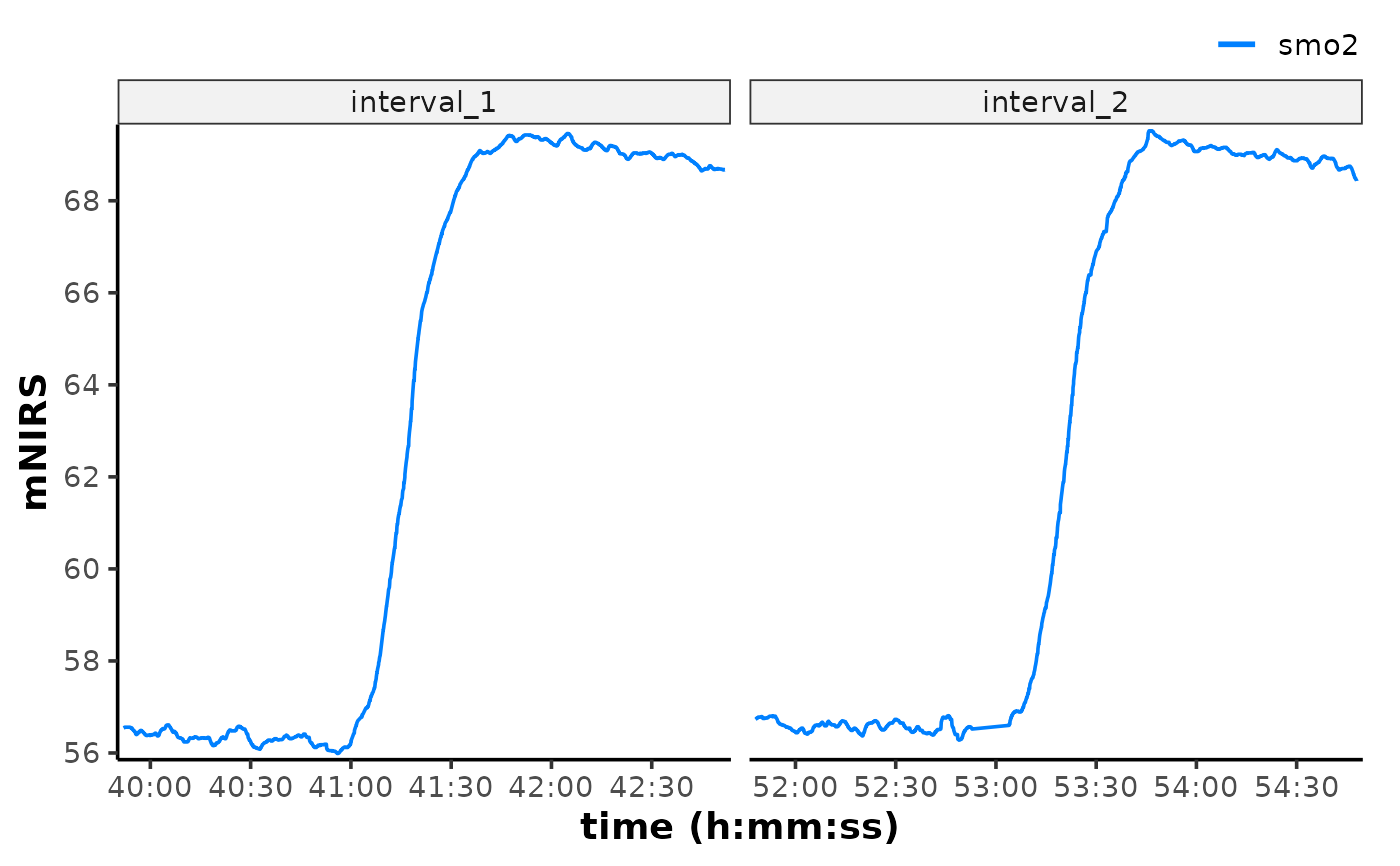
## plot a list of mnirs data frames as faceted panels
plot(data_list, time_labels = TRUE)
data_list <- extract_intervals(
data,
start = by_time(2452, 3168),
span = c(-60, 120),
verbose = FALSE
)
## plot a list of mnirs data frames as faceted panels
plot(data_list, time_labels = TRUE)