Convert numeric time span data to h:mm:ss format for pretty plotting.
Inspired by ggplot2::scale_x_time().
Details
If all values are less than 3600 (1 hour), then format is returned as
mm:ss. If any value is greater than 3600, format is returned as
h:mm:ss with leading zeroes.
Examples
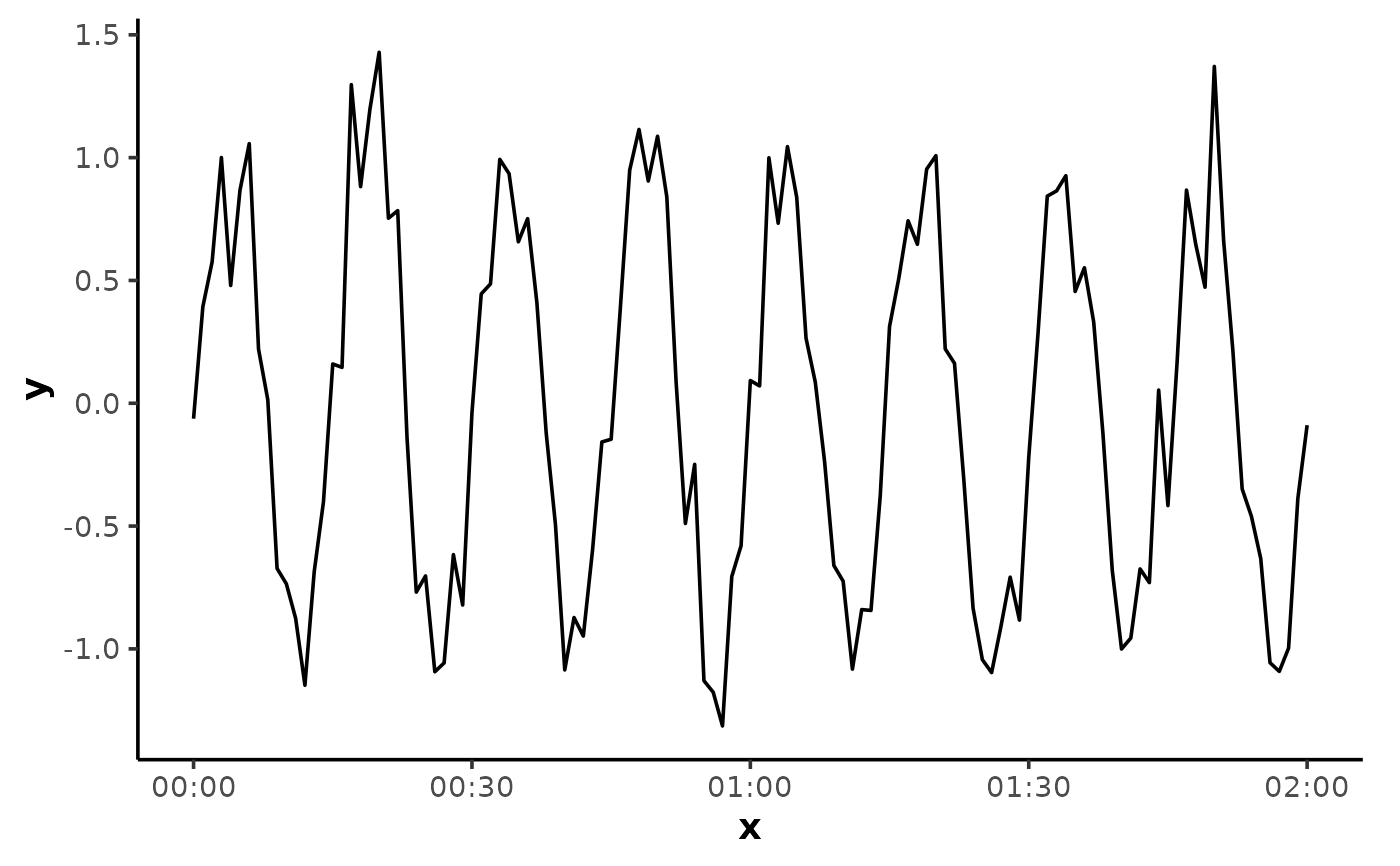
x <- 0:120
y <- sin(2 * pi * x / 15) + rnorm(length(x), 0, 0.2)

ggplot2::ggplot(data.frame(x, y), ggplot2::aes(x, y)) +
    theme_mnirs() +
    ggplot2::scale_x_continuous(
        breaks = breaks_timespan(),
        labels = format_hmmss
    ) +
    ggplot2::geom_line()