Pretty time span breaks for plotting in units of 5, 15, 30, 60 sec, etc.
Modified from scales::breaks_timespan().
Usage
breaks_timespan(unit = c("secs", "mins", "hours", "days", "weeks"), n = 5)Examples
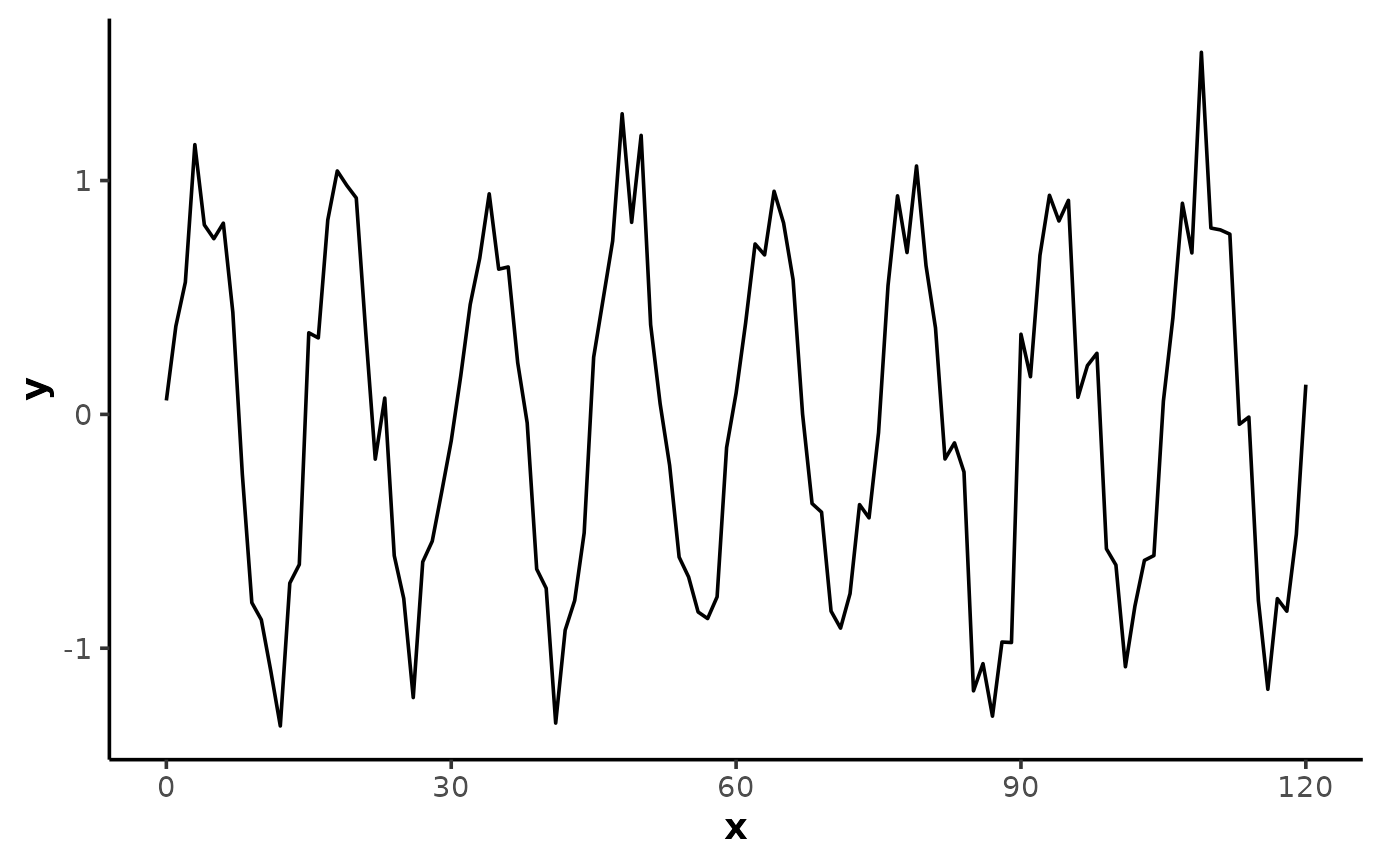
x <- 0:120
y <- sin(2 * pi * x / 15) + rnorm(length(x), 0, 0.2)

ggplot2::ggplot(data.frame(x, y), ggplot2::aes(x, y)) +
    theme_mnirs() +
    ggplot2::scale_x_continuous(breaks = breaks_timespan()) +
    ggplot2::geom_line()